What does AI network and system monitoring actually do?
It watches your servers, applications and background jobs, notices when something drifts from normal and acts on it. Agents read the logs to find the cause, apply fixes that are safe to reverse and open a ticket when a fix does not hold. On-call agents then work the ticket, and a person approves anything that changes code.
Illustrative example. Harbourline Logistics, a fictional freight company in Halifax, runs its shipment tracking portal on two servers. At 2:41 a.m. the database disk passes 90% because old logs have piled up. Nobody on the team is awake.
The monitoring agent sees the trend before the disk fills, rotates the oversized logs and confirms the space is back. Soon after, errors on the portal start to climb. That fault is not safe to fix automatically, so a ticket opens and the on-call agent starts investigating. By morning, the team finds a short summary and one change waiting for approval.
Traditional network monitoring would have sent two alerts and waited. The gap between noticing a problem and doing something about it is where outages grow. That is why this service belongs with our other AI for business agents instead of being one more dashboard.
How does anomaly detection spot problems before users do?
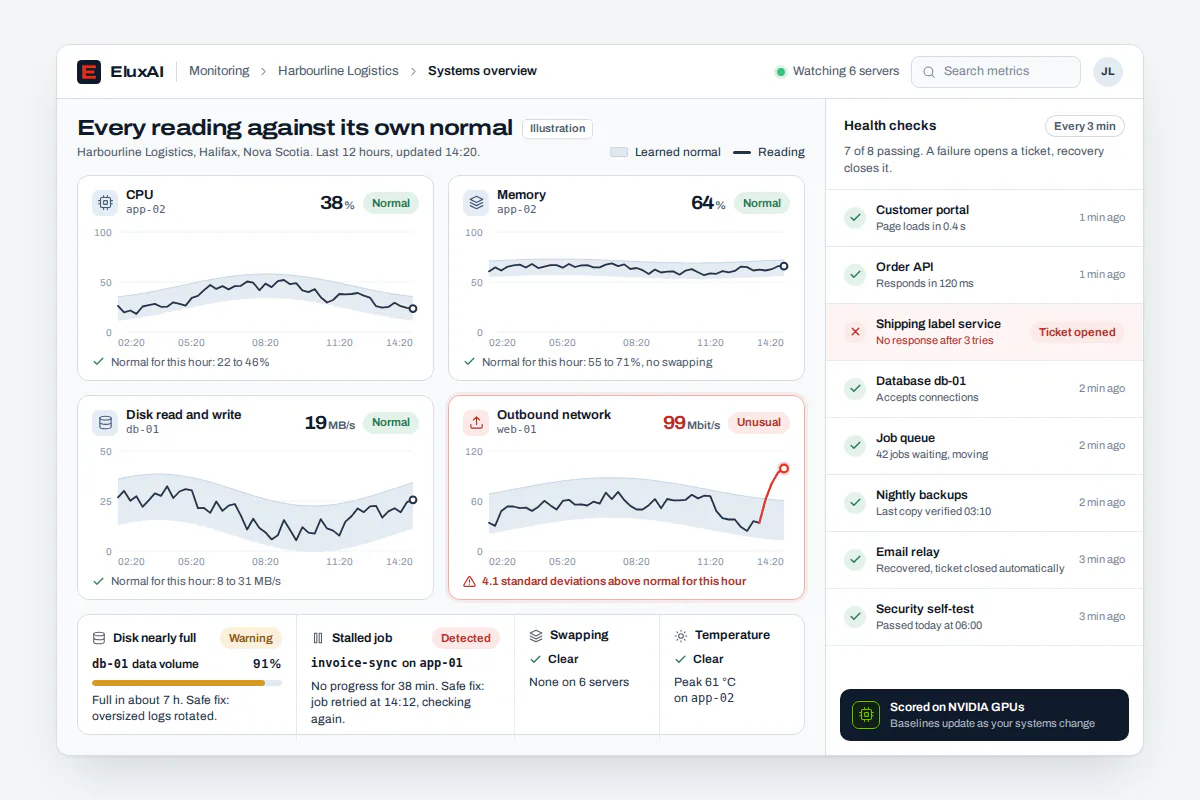
Instead of fixed thresholds, the system learns what normal looks like for every signal it tracks, such as processor load, memory, disk space and network traffic. Each new reading is scored against that learned baseline, so an unusual spike stands out even when it stays below a traditional alarm limit. Hard checks cover failures a baseline can miss, like a disk about to fill.
- Learned baselines: each metric builds its own normal pattern, so a quiet server and a busy one are judged fairly.
- Hard limits where they matter: disks and file handles running out, memory swapping heavily and hardware running hot.
- Stalled work: long jobs that stop making progress are caught even when nothing has technically failed.
- Dependency checks: the services your systems rely on are tested every few minutes, and an alert clears itself once the check passes again.
The result is fewer false alarms and earlier warnings. A threshold set too low wakes people for nothing. A threshold set too high stays silent until customers notice. Learned baselines avoid both problems.
How do the agents read logs and find the cause?
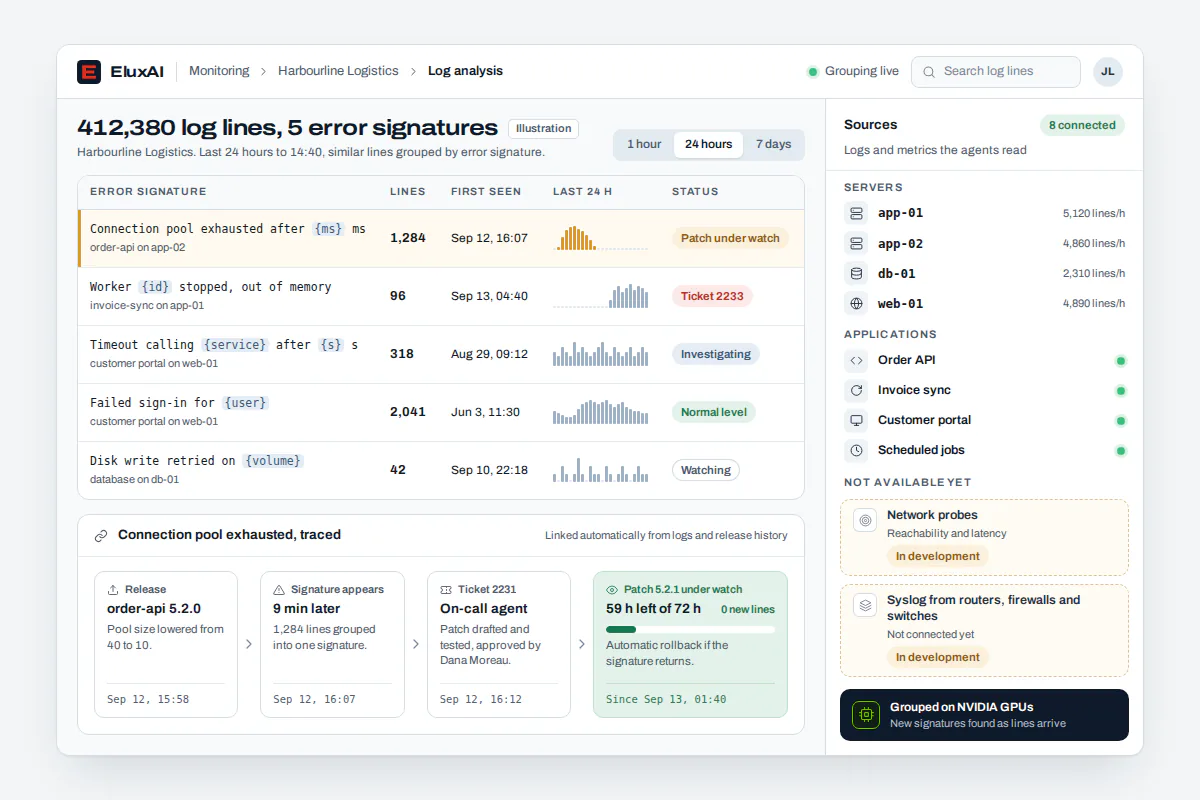
Logs hold the story of every fault, but nobody has time to read them at 3 a.m. Our agents do. They group repeated errors by signature, connect a spike in errors to the change or event that came just before it and write a short explanation on the ticket. After a fix, they keep reading the logs to confirm the error is really gone.
- Error signatures: thousands of similar lines collapse into one issue with a count and a first-seen time.
- Context: the agent checks what changed just before the fault, such as a release, a configuration edit or a surge in traffic.
- Plain explanations: tickets say what happened, what was tried and what the evidence shows.
- Follow-through: the same signature is watched after a fix, which is how a quiet recurrence gets caught early.
The Canadian Centre for Cyber Security treats logging and monitoring as a core part of protecting a network. The US NIST guide to log management makes the same point. Collecting logs is the easy part. Reading them consistently is where autonomous agents change the picture.
What can the system repair on its own, and what waits for a person?
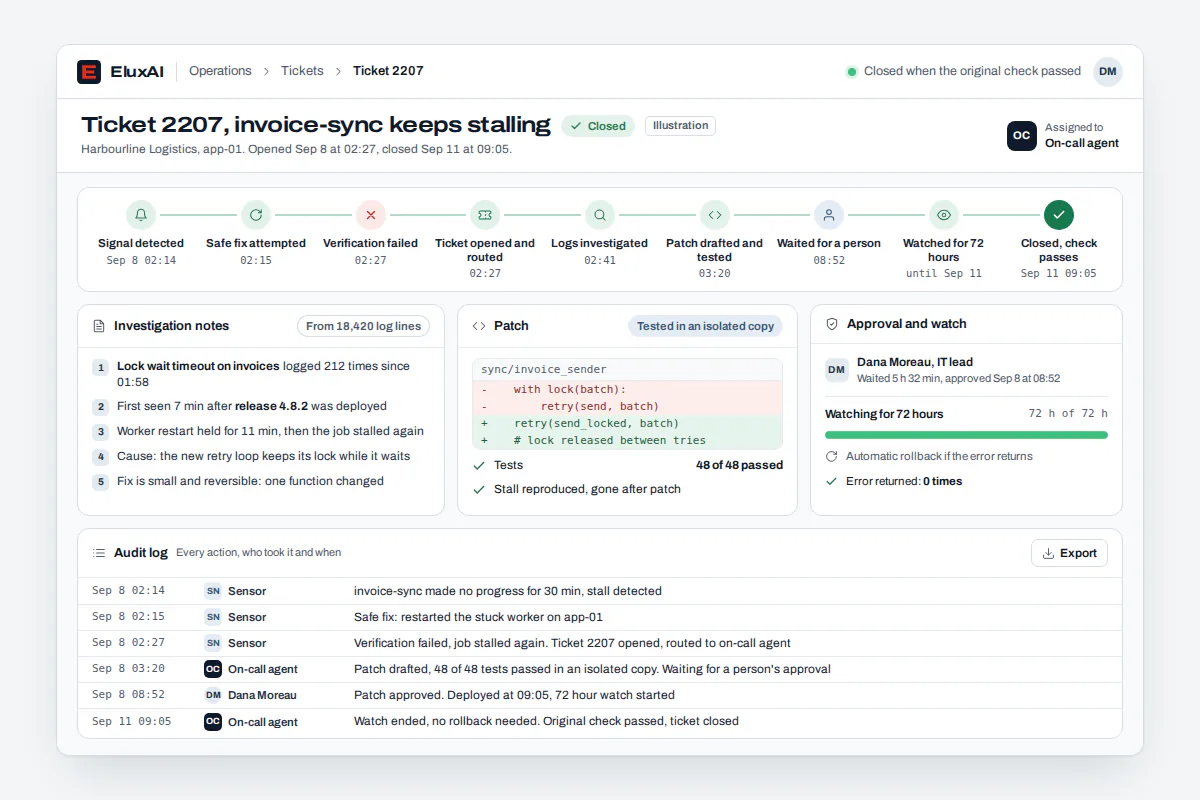
Safe, reversible fixes happen automatically: restarting a stuck worker, retrying a stalled job, clearing a full cache or rotating oversized logs. Anything riskier becomes a ticket. Code changes are drafted in an isolated copy, tested and then held for a person to approve. After approval, the change is watched and rolled back automatically if the original error returns.
- Detect: a sensor or health check flags the problem.
- Fix safely: if a reversible fix exists, it is applied and logged.
- Verify: the same check runs again to prove the fix held.
- Escalate: if the fix did not hold, a ticket opens for the on-call agent.
- Draft a patch: code changes are written and tested in an isolated copy, never on the live system.
- Approve: a person on your team reviews and approves the change.
- Watch and roll back: the change is monitored for three days and reversed automatically if the error comes back.
Governance is built in. Every automatic behaviour can be switched off on its own. You can start with detection and tickets only, then allow safe fixes once you trust the results. Every action lands in an audit log, and a company-wide kill switch stops all agents at once.
How are tickets opened, worked and closed autonomously?
Each problem becomes one ticket, not a flood of duplicate alerts. The orchestrator hands the ticket to the agent on call for that kind of issue, who investigates, applies what is safe and documents every step. When the fix holds, the ticket closes and the check that raised it keeps running. People can open tickets too, and agents work them the same way.
- No duplicates: repeated alerts about the same problem attach to one ticket.
- On-call rotation: infrastructure, code and quality issues each go to the right specialist agent.
- Proof, not promises: a ticket is resolved only when the original check passes again.
- Security included: a daily security self-test opens tickets for anything it finds.
This is the same ticket desk that runs behind our custom AI agents. For deeper, authorized testing of what attackers can see from outside, pair monitoring with AI penetration testing.
What is in development: network probes and syslog ingestion?
Two capabilities are in development at EluxAI Labs. Network probes will check reachability, latency and service health across your network. Syslog ingestion will let routers, firewalls, switches and other devices send their logs straight to the agents. Both extend the same detection, repair and ticket engine described on this page, and we confirm availability during your assessment.
Until they are released, monitoring covers the servers, applications and services where agents run or have access. We describe roadmap items plainly because monitoring is a job where overpromising does real damage.
The work behind these features follows the same rule as the rest of our research. Novel ideas are tested at EluxAI Labs and in the EluxAI Incubator on real workloads before they reach a client system. That is how a revolutionary idea becomes a dependable feature.
Monitoring tools, managed IT services or autonomous agents: which fits?
Monitoring tools detect and alert. Managed IT services add people who respond, often under business-hours agreements. Autonomous agents detect, investigate, fix what is safe and work tickets around the clock, with people approving risky changes. These options combine well. If you already have a managed IT provider, agents can handle first response and hand over better tickets.
| Option | Detects problems | Reads logs | Fixes safely on its own | Works tickets overnight | Proves the fix held |
|---|---|---|---|---|---|
| Network monitoring tools | Yes | Some | No | No | No |
| Managed IT services | Yes | Yes, by people | Sometimes | Depends on the contract | Varies |
| AIOps platforms | Yes | Yes | Limited | Rarely | Varies |
| EluxAI AI Network and System Monitoring | Yes, on learned baselines | Yes, by error signature | Yes, reversible fixes | Yes, with on-call agents | Yes, the check runs again |
Verdict: tools tell you something broke. Autonomous agents tell you what broke, fix what they safely can and show you the proof.
Which teams can use autonomous monitoring?
Any team running systems it cannot watch every hour. Web and SEO agencies can keep client websites and forms online. App developers and software companies can catch errors right after a release. Clinics, property managers and manufacturers with their own servers can get overnight coverage without a night shift. Managed IT providers can use agents for first response.
- Agencies: client sites, forms and hosting accounts watched, with tickets ready before a client calls.
- App developers and software companies: errors grouped the minute a release goes out, with rollback when a change misbehaves.
- Clinics and professional practices: booking and records servers kept healthy outside office hours.
- Manufacturers and logistics firms: scheduling and inventory systems watched so stalled jobs never hold up a shift.
- Managed IT providers: first response handled around the clock, with clear tickets for your technicians.
Teams that build their own software can connect monitoring to the AI app builder, so fixes are drafted by the same agents that wrote the code. To scope coverage for your systems, talk to our Canadian team.
Built on NVIDIA: analysis that keeps up with every signal
Monitoring produces a steady stream of numbers and log lines, and understanding it quickly takes serious computing. Our agentic system runs on our own NVIDIA GPU server, where language and embedding models read logs, group errors and draft explanations without sending your operational data to a public service.
Speed matters most while a fault is unfolding. NVIDIA states that its GB200 NVL72 system delivers 30 times faster real-time large language model inference than NVIDIA H100 systems. That pace of innovation is why we chose NVIDIA as the foundation for agents that have to think clearly at 3 a.m.